Introduction
Recently the developer ecosystem team at Samsung conducted a survey to elicit responses from developers on the tools that they are using currently on various platforms (desktop and mobile) and across APIs.
Context
The questions were grouped into categories that separated desktop from mobile (OpenGL vs. OpenGL ES), and capture & analysis from performance.
There were also some more open ended questions that attempted to discover the rationale behind tool choices and to discover if the lack of comprehensive open source multi-platform multi-API tools are impeding the creation and optimization of software across multiple vendors GPUs with the best performance experience for each.
Results
Capture & Analysis
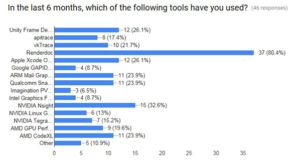
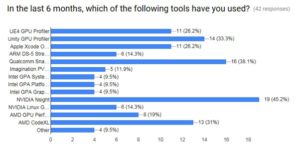
Over 80% of respondents indicated that they have used RenderDoc in the preceding 6 months. The next closest tool garnered 32.6% (NVidia Nsight) showing a very clear indication of the popularity of RenderDoc.*
Desktop OpenGL
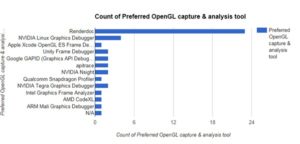
In the breakdown of preferred OpenGL capture & analysis tool RenderDoc took over 50% of the votes, the remaining portion split amongst the other tools with the next best score being 9.3% (NVidia Nsight). This category represents desktop GL developers (PC)
Mobile / OpenGL ES
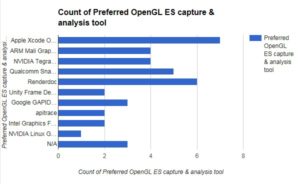
In the mobile segment (OpenGL ES) the distribution of tool usage is much more evenly spread, Apples Xcode tools take the lead (17.9%) with RenderDoc second with 15.4%. To be considered however is that RenderDoc is not available for macOS and the tight integration of Xcode (as well as the capability of the tools) provides a strong tailwind for apple provided tools on the Mac.
Preferred mobile tool (Android/ios)
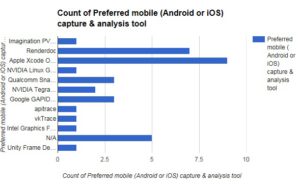
The distribution of tool usage in this segment is more evenly spread; Apples Xcode tools take the lead (25.7%) with RenderDoc second with 20%. To be considered however is that RenderDoc is not available for macOS and the tight integration of Xcode (as well as the capability of the tools) provides a strong tailwind for apple provided tools on the Mac.
Vulkan
The preferred Vulkan capture and analysis tool again favoured RenderDoc (61.1%) with the next highest coming in at 8.3% (vkTrace)
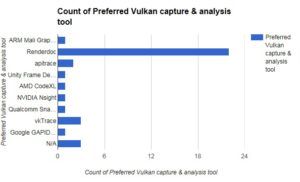
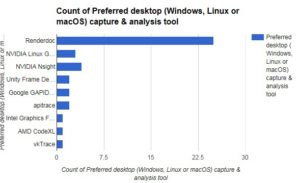
Preferred desktop tool
61% of respondents indicated that RenderDoc is their preferred tool. The next closest tool garnered 9.8% (NVidia Nsight) showing a very clear indication of the popularity of RenderDoc.
GPU Performance Analysis
GPU performance analysis tools are generally supplied by the GPU vendor. Unlike capture and analysis tools there is not currently an open source tool that works for multiple GPU’s due to the lack of a vendor neutral method for getting access to hardware performance counters. This void may be filled in the future by tools such as RenderDoc or LPGPU2 building upon a common & standardized API.
For GPU performance analysis the most popular tool was NVidia Nsight with almost half of the respondents using the tool (45.2%), with Qualcomm’s Snapdragon profiler being used by 38.1%.
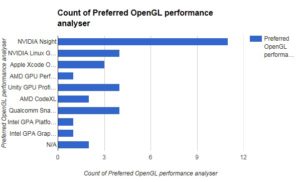
Preferred OpenGL performance analyser
Given the results in the table above NVidia’s Nsight is unsurprisingly the most popular choice in this category with a third of respondents preferring it (33.3%). Another 3rd is made up equally of Qualcomm’s Snapdragon Profiler, Unity’s GPU Profiler and NVidia’s Linux Graphics Debugger.
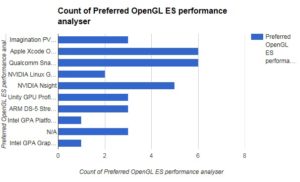
Preferred OpenGL ES performance analyser
In this category Qualcomms’ Snapdragon Profiler and Apple’s XCode tie with 18.2% each, the next closest is NVidia’s Nsight at 15.2%.
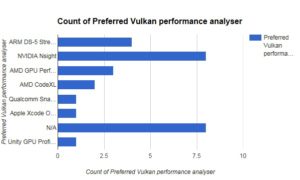
Preferred Vulkan performance analyser
In this category NVidia’s Nsight is the most preferred at 28.6%, with ARM’s Streamline at 14.3%. This distribution may reflect that more Vulkan development is currently being done on the desktop vs. mobile devices.
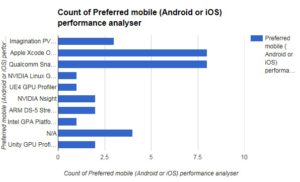
Preferred mobile performance analyser
In the mobile performance analyser category Qualcomm’s Snapdragon Profiler and Apple’s XCode tie with 25% each, the next closest being Imagination’s PVRTune.
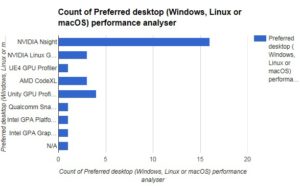
Preferred desktop performance analyser
NVidia’s Nsight is the preferred choice of 51.6% of respondents with the next closest Unity’s GPU profiler with 12.9%.
Developer satisfaction stats
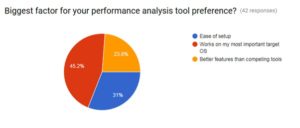
The most important factor for performance tool preference was the availability of the tool on their primary target. This was seen as more important than ease of setup, and even the features within the tool.
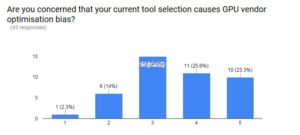
A significant portion of respondents were concerned that their tool selection caused GPU vendor optimization bias and a similar distribution stated they would prefer a high level cross platform tool (rather than multiple low level vendor specific tools).
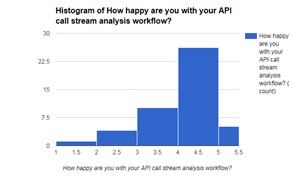
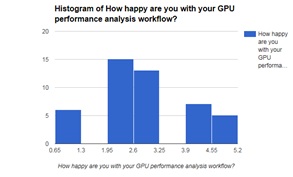
Whereas for capture & analysis 56.5% or respondents rated their happiness as 4/5 this was only 26.1% for GPU performance analysis indicating that a significant portion of respondents are not happy with their GPU performance analysis workflow.
General Summary
Over 81% of respondents are using custom or in house engines indicating their need to either develop or license a tool (rather than getting it with an engine such as Unity)
Android is the largest targeted OS, followed by Windows, Linux, IOS and macOS.
Conclusion
Users are satisfied with their current API capture tool-sets this may be due to the roughly equivalent functionality across each of these tools
There is much more dissatisfaction in the usage of performance analysis tools. Due to the lack of a standard mechanism to access hardware counters, developers are locked into using vendor specific tools which certainly reinforces optimization bias.
* Note that respondents used multiple tools which accounts for the individual tool tallies exceeding 100%

Comments are closed.