Author Archives: Martyn Bliss

Samsung adds Tizen support to LPGPU2

Even though the LPGPU2 project has concluded the work continues…

Thanks to the data driven nature of the DC API and the Remote Protocol designed by Samsung for the LPGPU2 project, moving to new hardware or even a new operating system becomes much easier.

After a few short weeks of work, using the source code from the public LPGPU2 repo ( https://github.com/codeplaysoftware/LPGPU2-CodeXL ) we are able to successfully connect to a Tizen mobile device, read back counters (via DC API), and intercept API calls (thanks to the shim).

The screen shots below show captured API and counter data: (click to view larger images)

Why don’t you check out the LPGPU2 repo and see what new devices and operating systems you can enable today?

EUResearch Magazine Article on LPGPU2

Over the past weeks and months, we’ve been busy working with the good people at euresearcher.com to produce an article all about LPGPU2.

You can read the article (and find out more about the LPGPU2 project) here: The LPGPU2 Project

Final Press Release goes Live: September 12th 2018

Today the consortium issue the final press release for the project. Find out about our work on Data collection, analysis and automated suggestions for and OpenGL ES for mobile devices (mainly Android) here: https://lpgpu.org/wp/publications/press-release-2/


1 line change for 50% power reduction? Oh yes!

As you know recently the LPGPU2 tools team at Samsung have been investigating core affinity on various Android devices.

This work started after some internal discussions with another team and led us to start adding support for viewing thread affinity, so we could monitor the number of times our application thread(s) were being migrated.

Once we observed how much thread migration was taking place we added support to the LPGPU2 API to both get and set thread affinity and then raw tests in various configurations with different affinity options.

See all the gory details here: https://lpgpu.org/wp/wp-content/uploads/2018/05/Profiler-Apps-Report-Affinity-Experiments.pdf


LPGPU2 at Autonomous Vehicle Test & Development Symposium 2018

The automotive industry as you may be aware is very much in the business of providing more ADAS (Automotive Driver Assist Systems) features in todays’ vehicles. This is to:

  • Meet the increasing demanding (European) NCAP safety ratings for cars
  • Safety features sells cars
  • To differentiate one manufacturer from another

The ADAS devices today are becoming ever more complex and capable to the point they are likely to make up most of the future autonomous vehicles’ systems. In any domain where safety is a priority the development of such systems must meet functional safety specifications as well as technical requirements. The safety assurances asked for during the development of such systems include how those systems operate in their environments.

The automotive industry is changing. In the past they have been conservative in their approach to development of vehicles’ systems, often years behind the curve. This is because it takes a large amount of time to verify and re-verify systems are safe. Until recently one approach to safety was to reduce as much as possible the complexity of the systems where ever possible. Today in order to meet the challenge of providing semi-autonomous driver aids by 2025 they are gravitating to solutions that are increasingly complex. Also, such solutions are being developed outside the realm of safety, outside of the automotive’s traditional chain manufacturing; OEMs, Tier 1, Tier 2 and smaller manufacturers. The growth in software complexity has impart be due to adopting Artificial Intelligence (AI) components to form part of their solutions.

Figure 1: The CNN software compute stack

As you may be aware AI solutions involve many layers of software – the CNN (compute neural network) software stack. The interactions between the layers is complex as state, data, commands, kernels and results are spawned and move between layers to and from the hardware.

Figure 2: Without inspection tools developers are guessing

For the automotive systems of the future to be safe it is another example of where the work carried out by the LPGPU2 project can be applied beyond the traditional mobile domain. Understanding the power usage and performance of the hardware and how the software interacts on top is vitally important where vehicles’ ECUs are generally low power passively cooled units.

The integration of complex software with hardware while meeting tight development constraints is a challenge for all automotive companies. For functional safety engineers the scope of concerns with an expanding code base supporting diverse hardware is immense. As Khronos moves open standards APIs such as OpenCL(TM) and SYCL(TM) to be ISO 26262 compatible, automotive manufacturers are looking to address the gap by working with researchers and companies to meet the demand.

At the Autonomous Vehicle Test & Development Symposium 2018, Codeplay presents a talk on the LPGPU2 CodeXL profiling tool for CNN using Tensorflowâ„¢ as a use case. The presentation gives a holistic overview of the compute stack and talks about how the tool can probe the otherwise concealed layers in the compute stack. How the tool can capture and analyse power profiles alongside the API calls made. How the tool can provide analysis and feedback on the data captured to make improvements.

If you wish to read more about the conference, go here: http://www.autonomousvehicle-software.com/en/

LPGPU2 – Your ideal tool for system exploration

Recently the LPGPU2 team had discussions with another internal Samsung team on a possible issue with thread migration policy. In order to determine if this was even a problem we needed to add some instrumentation and take a look at some real data.

After some quick brainstorming, we decided to add another function to the LPGPU2 API to log the current thread affinity as a virtual counter. With some minor changes to the RAgent, we were able to inform CodeXL that there was a new counter available (in addition to those normally provided) that was tracking affinity.

The next step was to add a call to the new API from within our application’s main thread, rebuild and then collect some data.

Initially the results indicated a lot of migration occurring (we are logging the current CPU once per frame update so around 30fps in this case):

Figure 1 – lots of thread migrations

However by making the CPU work harder (in our case by increasing the amount of data we were collecting from the application while logging affinity) we saw the following:

Figure 2 – reduced thread transitions

Our current conjecture is that because the CPU’s are now working harder this discourages migration and so we see a more stable thread affinity result. We aim to do some more explorations around this topic and will provide an update on this in the coming weeks.

Using the LPGPU2 Feedback engine for a deep dive into the Android Application Lifecycle

GL and the Android Lifecycle

LPGPU2 Feedback Engine

Motivation

This study arose from an attempt to track GL resources with the LPGPU2 Profiling Tool and Feedback Engine. Every glCreate* function should have a matching glDelete* function, for example, and we would like to either confirm this or else detect its omission. The LPGPU2 Test Apps were used during the development of the resource/state tracking component of the feedback script.

When the script was completed, the LPGPU2 Feedback Engine once again revealed something previously unknown: all of the GL ReplayNative-based LPGPU2 Test Apps leak resources!

Introduction

Software applications used to have a very simple lifecycle:

  1. Start-up
  2. Run

At some point it became important to ‘clean up after yourself’ and this was extended to:

  1. Start-up               (initialise, load, setup, etc.)
  2. Run                        (workload, task, job, etc.)
  3. Shutdown           (finalise, save, teardown, etc.)

Many applications still follow this basic model, but the need to squeeze every ounce of performance from complex platforms running dozens of apps on hundreds of processes and threads has driven Application Lifecycle Management (ALM) to more fine-grained idioms.

Large and complex frameworks, tools and services implementing well-established patterns now enjoy widespread adoption, and even Operating Systems have moved beyond Boot -> Run -> Shutdown as they can be put into sleep, hibernate, safe modes and different levels.

ALM is particularly important for mobile devices because of the inherent power limitations. The Android operating system was designed from the ground up for mobile devices. Android exposes sophisticated ALM support through its android.app.Activity class. The simplest view of the lifecycle of an Android app is show in Figure 1.

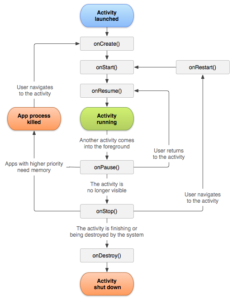
Figure 1 – Android Application Lifecycle
© Google – https://developer.android.com/guide/components/activities/activity-lifecycle.html

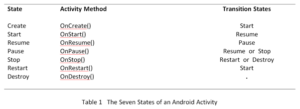
This lifecycle, encapsulated in the Android Activity, can be modelled as a finite state machine with seven nodes, and implemented by seven appropriately-named member functions of the class. These states and their transition states with their equivalent member functions are detailed in Table 1.

The increased functionality of better ALM comes at the price (as is so often in the case) of code complexity, because the lifetimes of all the applications resources need to be carefully shepherded through these states.

The LPGPU2 Feedback Engine has sophisticated object usage and lifetime tracking that can be used to check an application is behaving correctly throughout its lifecycle.

The Lifecycle of LPGPU2 Test Apps

Until now, we have focussed on the performance of the app main loop; the LPGPU2 Profiling Tool has been used to launch an app and begin profiling. The Tool continues profiling until the stop button is clicked. At that point no more data is gathered, the remaining profile buffer is flushed from the device, and only then is the app shut down (or killed).

It is not possible under the present framework to check for an app closing down cleanly because all LPGPU2 test apps so far, run indefinitely once inside the main loop. To rectify this, the ReplayNative app (basis of the Raymarching, Overdraw, OverdrawTex, Menger, Globe and Uber LPGPU2 Test Apps described elsewhere) has been extended to optionally run for a specified number of frames and then shut down cleanly. It is possible to run for a single frame, though because the apps are double-buffered, and because of the positioning of the swap-buffers command in the main loop, there will be no visible output in this case. It is also possible to run for zero frames in which case only initialisation and finalisation is executed – a useful test in itself.

None of this affects the LPGPU2 Profiling Tool – capable of collecting counter data even after an app crashes or if no app runs at all. The benefit here is in the collected database which will contain every single API call of an application run, from the very beginning of its lifecycle to the bitter end. This, in turn, means that the LPGPU2 Feedback Engine can analyse the profile for resource management issues accurately, in addition to the wide range of situations it already analyses, detects and diagnoses.

Insights and Improvements

This study arose from an attempt to track GL resources in the Feedback Engine. Every glCreate* function should have a matching glDelete* function, for example. Every glGen* function should also have a matching glDelete*, and we wanted to detect this. (The two glGenerate* functions, of course, are a special case and do not fit this pattern.) The LPGPU2 Test Apps were used as targets during development of the resource- and state-tracking component of the LPGPU2 feedback script.

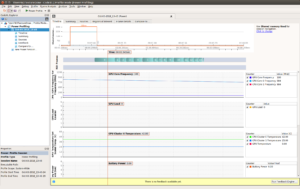
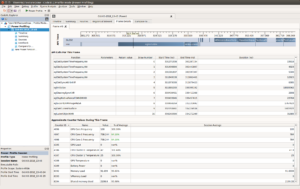
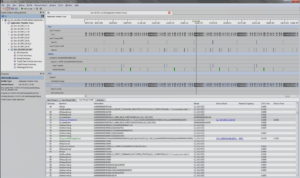
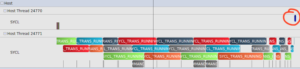
The improved LPGPU2 Feedback Engine and the Call Sequence Analysis was run and immediately revealed something previously unknown – that all of the ReplayNative-based LPGPU2 Test Apps were leaking resources. The annotations emitted are shown in figure 2.

An investigation into this revealed an initialisation function was being called twice: triggered once by the OnCreate() method of the Activity class and again by an UpdateViewport() method that is called when the surface and framebuffers and other resources are being setup. This needs to happen when the screen is rotated, for example. The design of the ReplayNative app is such that all of the setup code was in one function. This is because ReplayNative was been based on the earlier Lua-supporting ‘Replay’ app (also described elsewhere) that supported only initialisation and rendering, not finalisation.

It seemed natural and efficient to insert a single call to the initialisation function inside the unforeseen UpdateViewport() and to just ‘walk away whistling’ safe in the knowledge that the app was not ‘designed to shutdown’, and it worked for a long time.

However, LPGPU2 Feedback Engine detected the extra initialisation calls, found no matching clean-up calls, and promptly emitted the highest level severity ‘ISSUE’ level annotations on the grounds that there is no excuse for not cleaning up after yourself. These annotations are shown in figure 2.

Orphaned sets of shader programs, shaders, vertex buffers and textures are being generated by the Carousel app as it stands. This had never been an issue before, because these apps had never been shut down cleanly under profiling.

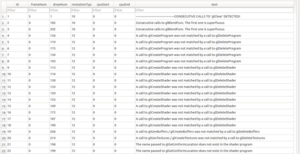
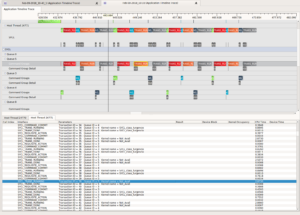
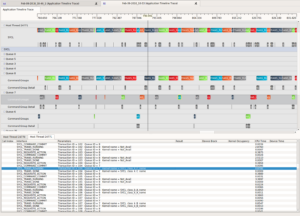
Figure 2 – Annotations emitted by the LPGPU2 Feedback Engine including many resource management issues for Shaders, Programs, Buffers and Textures

Conclusion

The LPGPU2 Profiling Tool and Feedback Engine are capable of tracking the state of resources through the entire lifecycle of an app. A design flaw in the ReplayNative base app – initially acknowledged, tactically ignored and inevitably forgotten – was unlikely to have been rediscovered without the LPGPU2 Feedback Engine.

Exploring SYCL with LPGPU2 CodeXL

This blog will give a quick run through of the SYCL™ profiling features that have been developed in the latest version of LPGPU2 CodeXL. LPGPU2 CodeXL is not yet available to the public but it was made available to the LPGPU2 consortium during February 2018. It is the aim to make a version of CodeXL with SYCL profiling features available when the project is completed.

For Codeplay, extending CodeXL to support SYCL API call time tracing makes a lot of sense because we develop using SYCL every day, and can make great use of the features to track down issues and optimize code. The original CodeXL project already supported OpenCL™ API time tracing using AMD’s OpenCL libraries so extending this to support SYCL was a logical activity. In addition, extending the range of open standards available using CodeXL was also one of the requirements for the LPGPU2 project. In addition to supporting open standards and power profiling on low power devices like the Android phone shown in previous LPGPU2 videos, TensorFlow was added to the project enabling CodeXL to work with machine learning compute stacks on low power devices. At the annual HiPEAC conference the Codeplay team presented a poster session explaining how the LPGPU2 CodeXL tool can be used support this work.  Figure 1 shows a miniature of the poster. If you are interested in seeing the poster in full detail like the other images in this blog, please click to enlarge.

Figure 1 – HiPEAC poster

Let’s see some examples of the new features and support developed as part of the LPGPU2 CodeXL project. Figure 2 shows the collection of power data counters from low power devices in addition to profiling AMD’s specific hardware. More specifically the image shows a comparison of two power counter data profiles.

Figure 2 – Power counter data comparison between two separate capture sessions

Figure 3 – Profile session showing the relationship between OpenCL and SYCL API calls

Figure 3 visualizes the capture of OpenCL API calls vertically alongside the SYCL API calls. It is this capability, unique to LPGPU2 CodeXL, which enables the visualization of the different operations and dependencies made as they move down from the attraction layers at the top of compute stack to the device itself. Note if a non-compatible OpenCL is being used, i.e. not able to provide hooks into the API calls, then only the SYCL API calls are shown. For clarity and space subsequent images in this blog only shows the SYCL API calls.

Figure 4 – The extended time trace execution mode of LPGPU2 CodeXL supporting SYCL call tracing

The original CodeXL application tool has 4 executions modes each able to perform different kinds of data capture and profiling operations depending on your requirements. The execution modes are effectively four tools in one. One of the execution modes is the Time Trace execution mode. In this mode the original tool was able to capture and visualize the (AMD) OpenCL API calls made from a targeted application on the host machine or remote AMD machine. The LPGPU2 CodeXL tool has extended this mode to enable the capture and display of SYCL API calls as well as the OpenCL calls. Figure 4 shows a typical SYCL profile capture. Note the additional information provided in the list view. Besides the SYCL transaction IDs shown in the lower list view of figure 4 it is the aim in the future to more contextual information about the various API calls and state to be better informed on how the actions in the compute stack drive real behavior.

LPGPU2 CodeXL tool compatibility

LPGPU2 CodeXL tool is able to profile SYCL 1.2.1 using ComputeCpp™ Community Edition, Codeplay’s SYCL implementation. It can also profile a wide range of SYCL related libraries such as:

  • SYCL-ML: A C++ library implementing the classical machine learning algorithms
  • VisionCpp: A machine vision library written in SYCL and C++ that shows performance portable implementation of graph algorithms
  • SYCL-BLAS: An implementation of BLAS using the SYCL open standard for acceleration on OpenCL devices
  • SYCL-Ray Tracer: A SYCL enabled ray tracer

Why the LPGPU2 tool is a powerful tool for developing SYCL applications

To give you an indication of the importance of this work for Codeplay and SYCL developers in general, here are some quotes from the Codeplay ComputeCpp™ team:

While developing with SYCL it is important to understand the impact of scheduling with respect to calls to OpenCL. The LPGPU2 implementation of CodeXL will make this much easier”

“The LPGPU2 CodeXL project can help us to identify the hotspots in the low-level functionality of ComputeCpp™ and easily see the real impact of these bottlenecks”

“There are different situations where diagnosing timing issues between SYCL and OpenCL and tracking data dependencies across contexts are needed. The LPGPU2 CodeXL tool helps to reduce the time it takes to solve problems related to these issues”

Walk through the Profiling of a SYCL example

We’ll now work through an example of using LPGPU2 CodeXL to profile SYCL 1.2.1 using the multiple_enqueue code example found in the ComputeCpp™ SDK.

Figure 5 – Complete time profile for the multiple_enqueue example

Figure 5 shows the complete API time trace of the “multiple_enqueue” example. The example is made up of four parts to demonstrate how SYCL transactions can be executed. With the “multiple_enqueue” example’s providing inline code documentation we try to picture the workings and results in our mind. Using the LPGPU2 CodeXL tool removes the need to imagine the operations that can or should occur. The four red text areas in figure 5 very clearly show the four parts of the example and the SYCL API calls made as the code runs. The patterns of behavior can easily be identified. It is a very good example of how using the LPGPU2 CodeXL tool can be used to verify the intended behavior of your code. This example executed in about 1200ms; the first thing that can be highlighted is the very long time taken for the “Transaction Create” events compared to the rest of the profile. This is because the kernels require compilation before execution of the kernels can start.

Figure 6 – Linear single queue visualization

One of the simple but powerful features of using a visualization tool like LPGPU2 CodeXL is the ability to zoom into an area of interest in the timeline. Figure 6 shows in more detail the activity of the SYCL API calls and how the schedule is a series of transactions. Here we can clearly see the sequential behavior by using one thread and one queue. The visual is clearly showing what we would expect to see. Note in queue 0 the command group detail, it shows the “SYCL_COMMAND_COMMIT” occurs sequentially. Also note in figure 7 the Buffer Destroy event circled on host thread 24770 that occurs after all the transactions have finished.

Buffer destroy event

Figure 7 – Linear schedule multiple queues

Moving from left to right in figure 5 the next region shows the second part of the example code operating a linear schedule multiple queues model. Figure 8 shows a zoomed in screen capture of this. Looking closely, we can see that although there is more than one queue being used here, the schedule of transactions still has very much a linear dependency. The transactions are shown occurring on one host thread but over 3 queues; 3, 4 and 5. Queue 5 in this case is the host queue, the other two are device queues. Looking at the event list below the graph, we see the API call type with its transaction ID. We are able to tell which queues are associated with device calls since the runtime is able to provide kernel names for them. Incidentally the queues are listed in the order they were first used from top to bottom by the SYCL implementation and not when the queues were created. We can also see for this particular example that the host queue and its transactions are doing most of the work.

Figure 8 – Schedule diamond pattern

Moving on to the next part of the example which demonstrates the schedule diamond pattern, Figure 9 shows the zoomed portion of the profile along with the transactions in the events list view. The Figure 10 shows the activities we expect to see. Kernel D depends on the results of both kernels B and C. They in turn wait for kernel A to complete.

Figure 9 – Kernels used in diamond dependency example

Again, we can see the transactions taking place on the host queue and on the device queues. The diamond pattern would suggest that in this part of the example the code should set up and allow kernels B and C to operate in parallel once kernel A is complete. However, if you look closely at the profile we can see this is not the case, the transactions are behaving like they did in the previous example. Maybe this is a surprise to some but is due to the scheduling behavior of the underlying OpenCL runtime.

Conclusion

The LPGPU2 CodeXL tool with SYCL profiling support is already proving itself to be useful as a visualization and diagnostic tool. Within Codeplay the ComputeCpp™ team are using it to verify the operation of their implementation and the Codeplay team working on TensorFlow™ are using it to manage and visualize the vast number of kernels generated and the performance impact hotspots. As well as being used to profile code it is also a valuable teaching aid for demonstrating the concepts required to make the most of parallelism in the systems you are using.


New Starter at Samsung!

Simon Ennis has a background in computer science and mathematics, since graduating he has worked in various markets including the semiconductor industry and the medical industry.

Simon has a background in image processing both in academia and industry dealing with various algorithmic issues such as curve fitting and modelling of data and more recently the projection of pixel coordinates for retina imaging.

Simon is looking forward to the challenges that lay ahead as part of the LPGPU2 team where he will be working initially on validation infrastructure.


Converting existing apps to work with the LPGPU2 Tool Suite

Many of our potential customers for LPGPU2 may have existing applications that they want to use with the tool. In order to do this some minor modifications are required (this is due to wanting the tool to support commercial devices that are not rooted) and we feel the minor inconvenience of modifying your app is outweighed by being able to profile on end user devices.

In order to provide a worked example of this, we have taken one of the apps that Samsung developed as part of the project that implements different font-rendering methods (CPU & GPU) and written a report that describes what the app does and how we modified it to work with the tool.

Profiler-Apps-Report-FontRenderer-Shimify

In subsequent posts we will provide details on the results of the CPU vs. GPU font rendering analysis and best practices for using the LPGPU2 Tool Suite if you haven’t created your application yet.


By continuing to use the site, you agree to the use of cookies. more information

The cookie settings on this website are set to "allow cookies" to give you the best browsing experience possible. If you continue to use this website without changing your cookie settings or you click "Accept" below then you are consenting to this.

Close