Yesterday I was looked at the behaviour of one of our test apps (you can see an example of the sort of thing here ) after observing it behaving strangely on one of our test devices.
The application I was using runs through a set of ‘apps’ for a fixed number of frames and then loops. The first app being run was running slowly and not as fluidly as the others.
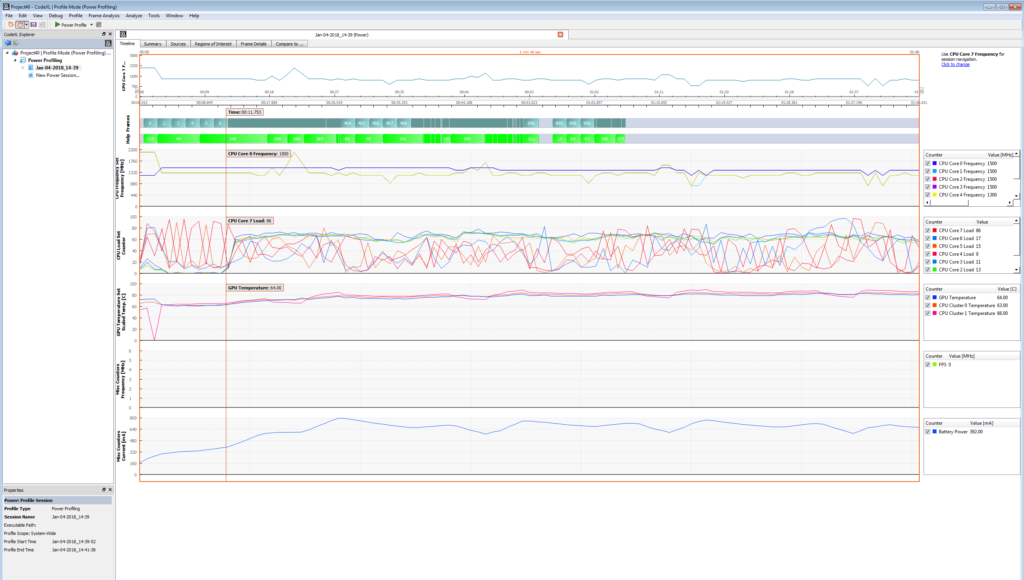
The first thing I did was to take a capture with the LPGPU2 tool and get a high level overview of what was occurring:
All of the counter data you can see if live and valid and reflects the system state at the time the graphics API calls from the application were being captured (GLES and EGL in this case).
Take a closer at the Regions of Interest (ROI) (shown in a blue gradient) and frames (shown in green)ribbons:
In the above you can see that there are ROI that correspond to the heavy content being equally spaced along the timeline. You can also see how these ROI align with frames.
The more astute of you may notice that the ROI and frames are not completely consistent yet, but this is all part of the toolset validation and will be addressed as the project progresses.


Comments are closed.